Devpost
Participate in our public hackathons
Devpost for Teams
Access your company's private hackathons
Grow your developer ecosystem and promote your platform
Drive innovation, collaboration, and retention within your organization
By use case
Blog
Insights into hackathon planning and participation
Customer stories
Inspiration from peers and other industry leaders
Planning guides
Best practices for planning online and in-person hackathons
Webinars & events
Upcoming events and on-demand recordings
Help desk
Common questions and support documentation
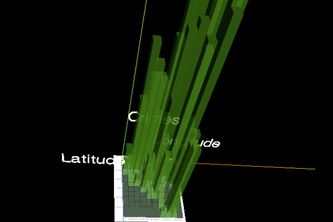
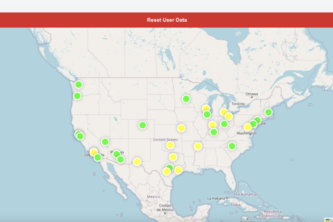
Mapping Solar Power Potential Across the U.S.
This project helps employers by matching resumes to keywords and sorts a list of best resumes.
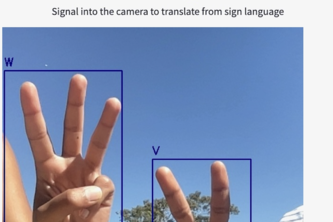
SwiftSign translates from ASL to English in real-time, bridging the communication gap and empowering hearing-impaired individuals.
We predict the level of fires at different locations in California based off its coordinates, month, and date.
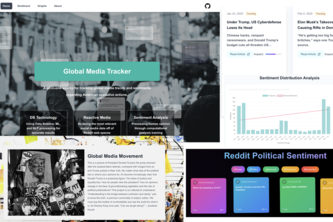
Scraping top political subreddits using NLP and few shot prompting to rate them on a continuous pro/anti trump meter, plotting change in trump sentiment on different subreddits over time.
Personal safety is always a top priority, and with RoutesITrust, you can become more aware of crime in your area and choose the safest option for your next walk, run, or hike.
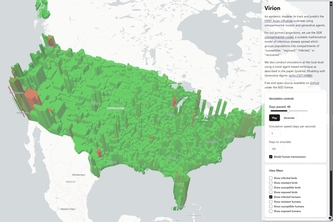
A fully interactive pandemic modeling tool for forecasting the H5N1 avian influenza epidemic and its possible threat to humans. We simulate the disease in each of the 3000+ counties in the US.
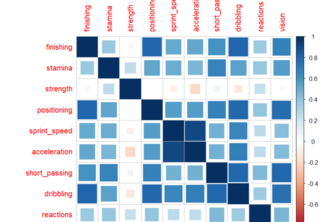
We are trying to find a model to predict whether a soccer player will be traded in the season they are playing in.
It is a data visualization project to identify educationally disadvantaged communities in California, through state standardized testing.
Hockey players come from a variety of leagues worldwide before making the NHL. We project a player's first 3 NHL season performances given a player's history and varying league skill levels.
a
Using the past to inform the future of fires for individuals and firms
Our project focuses on modeling correlations between Spotify streams and TikTok videos to help organizations identify trends in music for decision making in the Spotify/Tiktok creator space.
Analyze Clash Royale match data, finds popular decks using clustering, and predicts match results using machine learning.
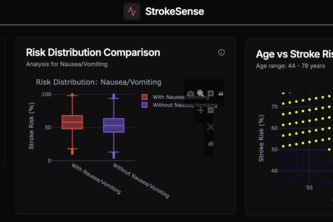
Built a React dashboard that visualizes stroke risk using interactive heatmaps, boxplots, scatter plots, and line charts. Our model predicts stroke risk based on age and symptoms for better insights.
Our project looks at voting patterns, focusing on why people don’t vote and how sociological factors such as income and political parties play a role.
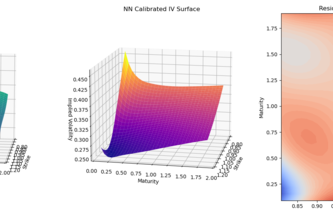
A rough Bergomi Stochastic volatility calibration system utilizing neural networks.
This is PACAN—Phuc Lu, Nathan Ho, Calder Glass, Aayushi Avabrath, and Anna Cha. Our Datathon project visualizes how poverty, unemployment, and inflation impact suicide rates to inform prevention.
Your demographic & data driven guide to livable cities.
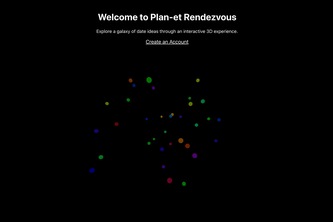
Explore a galaxy of date ideas through an interactive 3D experience.
When developing a game, it is imperative to know if players will like it. Use our model based on 50000+ Steam games to predict your total expected owners!
FlySafe offers real-time aviation safety insights with 3D visuals and risk assessments.
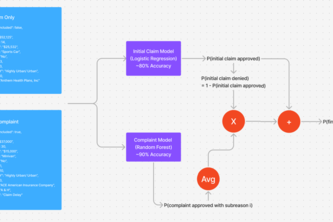
We aim to improve the experience of insurance claims for both claimants and insurers by providing a 2-stage AI that computes the probability of an initial claim being approved, after complaints.
When to pit is vital to an F1 team’s racing strategy as it can give a team huge advantages but also make them lose time, so it is beneficial to know when other teams pit
1 – 24 of 42